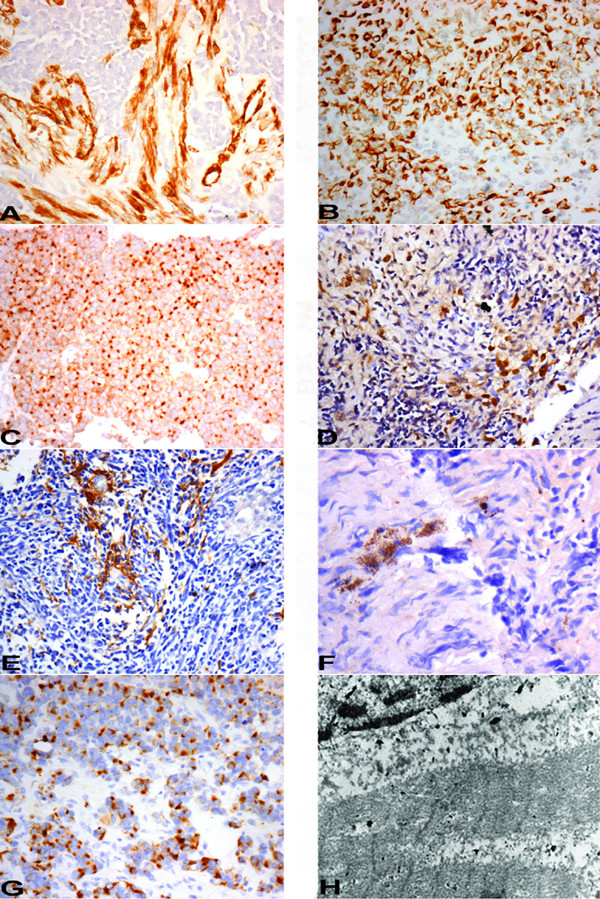
Figure 2.

A – SMA immunostain expression in the spindle cells and vessel (internal control) along with absence of expression in primitive neuroectodermal cells (20×, immunoperoxidase); B – Cytokeratin immnostain positivity (20×, immunoperoxidase); C – EMA immunostain showing paranuclear dot positivity (20×, immunoperoxidase); D – HMB-45 immunostain showing focal cytoplasmic positivity (20×, immunoperoxidase); E – GFAP immunostain positivity in glial areas (20×, immunoperoxidase); F – NFP immunostain positivity in few cells (40×, immunoperoxidase); G – Desmin immunostain showing paranuclear dot positivity (20×, immunoperoxidase); H – Ultrastructure of strap cells showing prominent Z bands (10000×, Uranyl acetate with lead citrate).
