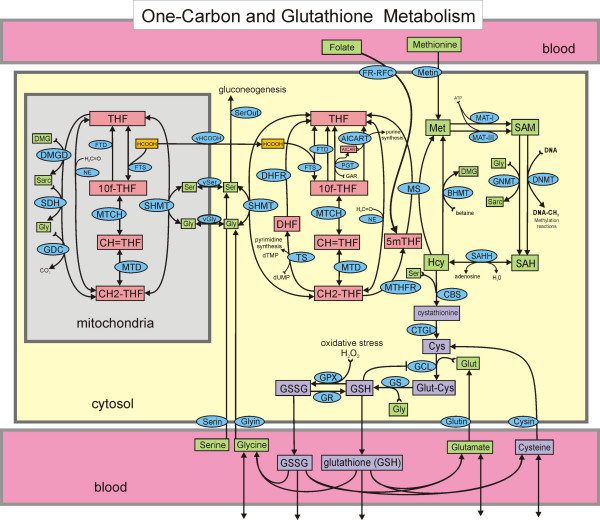
Figure 1.
One-carbon metabolism and the transsulfuration pathway. Rectangles enclose the names or acronyms of substrates that are variables in the model. Substrates not in rectangles are held constant or are the products of reactions that we do not keep track of. Arrows at the bottom of the figure represent import from the gut and other cells, and losses to other cells and to degradation. There is one differential equation for each substrate. The ellipses contain the acronyms of the enzymes that catalyze the reactions. Full names for all the enzymes and substrates, as well as a complete description of the mathematical model and the values of all parameters are given in the online Additional File 1.

