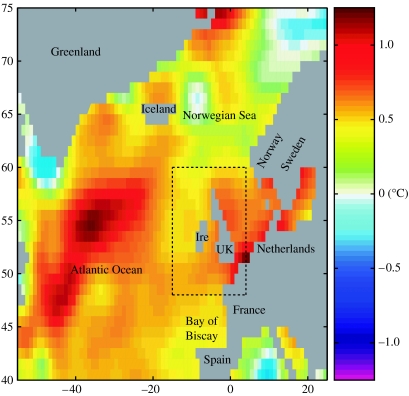
Figure 1.
Map of the study area, showing differences in annual mean SST (°C) between the two periods 1995–2005 and 1980–1994. Image resolution limited by climatological grid cell size. Dashed rectangle shows the UK and Ireland region used to calculate SST statistics in this study, where temperatures have risen by approximately 0.6°C since the mid-1990s.

