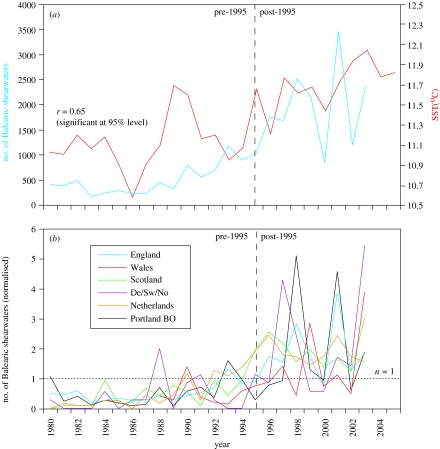
Figure 2.
(a) Time series for the period 1980–2003 showing annual totals of Balearic shearwaters in UK and Irish waters (blue), and annually averaged SST in the UK and Ireland region shown in figure 1 (red). (b) Time series showing numbers of Balearic shearwaters in northwest European waters from 1980 to 2003; note the consistent increase in numbers in the mid-1990s (vertical dashed line). Individual annual totals have been normalized relative to 1980–2003 average values; a value of 1.0 (represented by dotted line) is therefore equal to the long-term average, a value of 0.5 is half the long-term average, and a value of 2.0 is double the long-term average. Values for Denmark (De), Sweden (Sw) and Norway (No) have been combined. Portland BO, Portland Bird Observatory.

