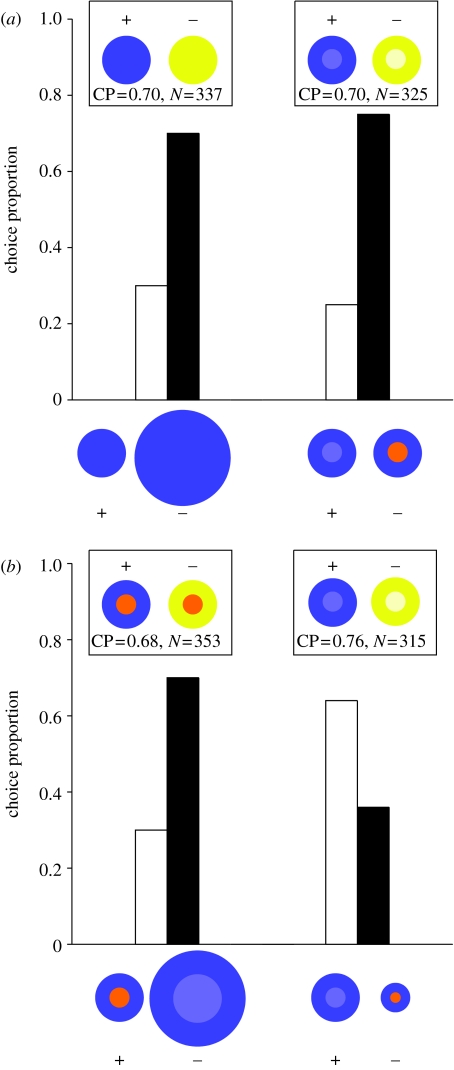
Figure 1.
Choice frequencies showing preferences for exaggerated size and colour contrast. In (a,b), the x-axis denotes the choice offered to the trained bees during testing and the bars depict the choice frequencies obtained in favour of each pattern. The insets show the training patterns, the total number of choices and the choice frequency for the positive pattern during training. (a) Varying size and contrast individually and (b) varying size and contrast simultaneously.

