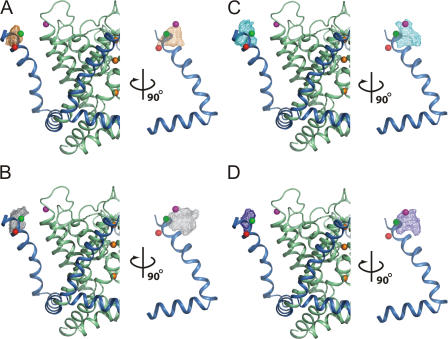
Figure 8.
Position of the first gating charge along the S4 segment (R294) in the open-activated conformation of Kv1.2 channel deduced from MD. The mesh plots encompass the volume occupied 60% of the time by the Cβ of residue 294 during the different MD simulations. The data shown includes the wild-type Kv1.2 channel (A, orange mesh), the Kv1.2 channel with R294H-A351H Zn2+ bridge (B, gray mesh), the Kv1.2 channel with the R294H-D352H Zn2+ bridge (C, cyan mesh), and the Kv1.2 channel with the R294H-D352H Zn2+ bridge and the substitution D352G-E353S (D, blue mesh). On the left is a side view from membrane and on the right is a side view from the pore. As a reference, the S4 segment (sky blue ribbon) and the pore domain (pale green ribbon) from the crystal structure of the Kv1.2 channel (PDB id 2A79) are shown. Three K+ ions are shown in the pore as orange spheres (left). The Cβ of residue 294 and the Cβ of residue 351 from the Kv1.2 x-ray structure are shown as red and magenta spheres, respectively. The Cβ of the residue at the corresponding position in the x-ray structure of the Kv1.2-Kv2.1 chimera PDB id 2R9R (Q290) is shown as a green sphere (assuming the same position for the pore domain). To record the probability density of the Cβ of residue 294 from the MD, the pore domain (S5–S6) was oriented with respect to the x-ray structure for every snapshot, followed by increments of 90° rotations to superimpose the voltage sensor modules of the four subunits (Jogini and Roux, 2007), yielding four data points per snapshot. For the wild-type channel, one snapshot every 5 ps is included (total 20,000 points), for each mutant one snapshot every 2 ps from two trajectories is included (total 10,000 points).

