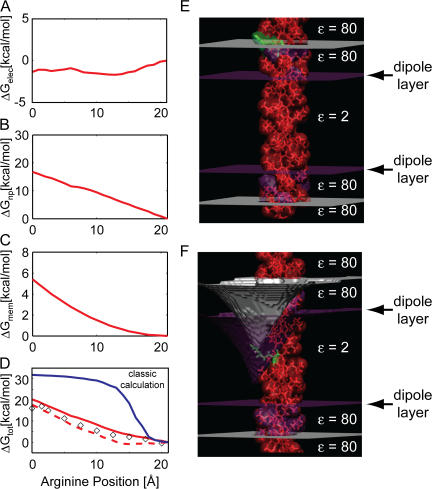
Figure 5.
Helix insertion energy of a model polyleucine helix with a central arginine. As the arginine enters the membrane, the upper leaflet bends to allow water penetration. At the upper leaflet, the arginine height is 21 Å, and it is 0 Å at the center. (A) The total electrostatic energy remains nearly constant upon insertion. (B) The nonpolar energy increases linearly to 18 kcal/mol as the membrane bending exposes buried TM residues to water. (C) The membrane deformation energy redrawn from Fig. 4 C. (D) The total helix insertion energy is the sum of A–C plus ΔGdipole, which is not shown (solid red line). Correcting for the optimal membrane deformation at a given arginine depth, as shown in Fig. 6 B, produces a noticeably smaller insertion energy (dashed red line). Our continuum computational model matches well with results from fully atomistic MD simulations on the same system (diamonds taken from Dorairaj and Allen, 2007). The result from a classical continuum calculation is shown for reference (solid blue line). (E) System geometry when the arginine (green) is positioned at the upper leaflet. This configuration represents the far right position on A–D. Gray surfaces represent the lipid head group–water interface, purple surfaces represent the lipid head group–hydrocarbon core interface. The membrane is not deformed in this instance. (F) System geometry when the arginine is at the center of the membrane. This configuration represents the far left position on A–D. The shape of the upper membrane–water interface (gray) was determined by solving Eq. 5.

