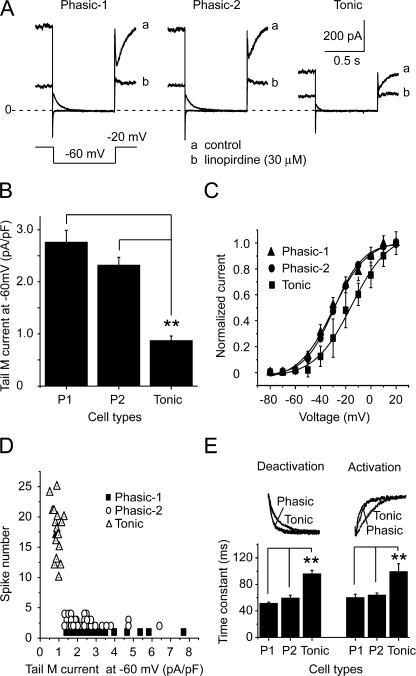
Figure 2.
Characteristics of M/KCNQ currents from phasic and tonic neurons. (A) Representative M/KCNQ current records of phasic-1, phasic-2, and tonic neurons. a is the control condition and b is after 30 μM linopirdine. M/KCNQ currents were evoked by the deactivating protocol shown under the current traces. Perforated patch method was used in these experiments. (B) Summary data for the densities of M/KCNQ current of phasic and tonic neurons. M/KCNQ currents were measured as the deactivating tail currents at −60 mV (see Materials and methods for detail). (C) The M/KCNQ tail currents at −60 mV preceded by multiple steps from −80 to +20 mV were used to produce the current–voltage (I-V) curves. The I-V relationship curves were fitted with the Boltzmann function. V1/2 for phasic-1, phasic-2, and tonic neurons was −30 ± 1 mV, −29 ± 1 mV, and −15 ± 3 mV, respectively. (D) Relationship between number of spikes fired and M/KCNQ current density. (E) Activation and deactivation of M/KCNQ currents. The top panel shows the normalized deactivating M/KCNQ currents from −20 to −60 mV (left) and the normalized activating M/KCNQ currents from −60 to −20 mV (right). The bottom panel shows the summary data for the time constants of deactivation and activation of M/KCNQ currents, which were fitted by single exponential functions. **, P < 0.01. Error bars indicate SEM.

