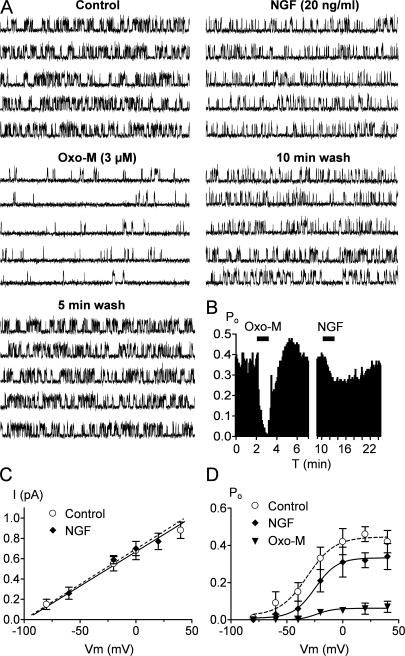
Figure 4.
Single-channel analysis of NGF action. (A) Single-channel records at 0 mV from a cell-attached patch containing one KCNQ/M channel, before, during, and after bath application of 3 μM Oxo-M and 20 ng/ml NGF. Five consecutive 1-s sweep are shown for each condition. Bars: 100 ms, 1 pA. (B) The time course of Po plotted against time for the experiment shown in A. Po calculated from 5-s periods. The application of Oxo-M and NGF are indicated by the horizontal bars. (C) Single-channel amplitudes derived from all point amplitude histograms were plotted against membrane potentials. The mean slope conductance obtained by fitting a linear regression was 6.5 ± 0.2 and 6.1 ± 0.2 pS (n = 5) in the presence and absence of NGF, respectively. (D) Mean Po-Vm curves determined in control and in the presence of NGF or Oxo-M. Data points were fitted by a Boltzmann equation, yielding values for Po,max, V1/2, and k of (control, ○) 0.44 ± 0.02, −32 ± 3 mV, 12 ± 2 mV; (NGF, ♦) 0.33 ± 0.08, −25 ± 2 mV, 10 ± 2 mV; (Oxo-M, ▾) 0.06 ± 0.005, −29 ± 3 mV, 8 ± 2 mV, respectively. Each data point is the mean ± SEM of 5–7 patches. Error bars show SEM.

