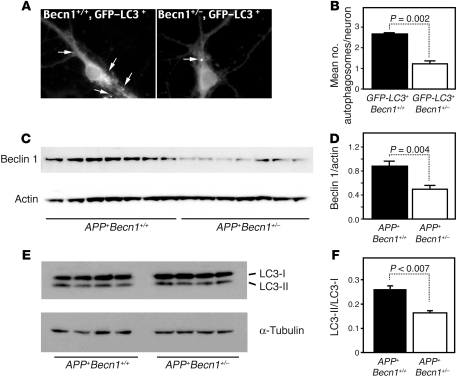
Figure 2. Beclin 1 and neuronal autophagy are reduced in Becn1+/– mice.
(A and B) Autophagosomes (arrows) were counted in 50 primary hippocampal neurons cultured from GFP-LC3+Becn1+/+ and GFP-LC3+Becn1+/– mice (n = 3 per group). Shown are representative images (A) and quantification (B). (C and D) RIPA buffer–soluble proteins from the cortex of 9-month-old female APP+Becn1+/– and APP+Becn1+/+ mice (n = 7 per group) were analyzed by Western blot and probed for beclin 1; values were normalized to actin levels. (E and F) RIPA buffer–soluble proteins from the cortex of 16-month-old male APP+Becn1+/– and APP+Becn1+/+ mice (n = 4 per group) were analyzed by Western blot and probed for LC3; values were normalized to α-tubulin levels, and the ratio between LC3-I and LC3-II was calculated. Values are mean ± SEM; mean differences were compared by unpaired Student’s t test. Original magnification, ×400.

