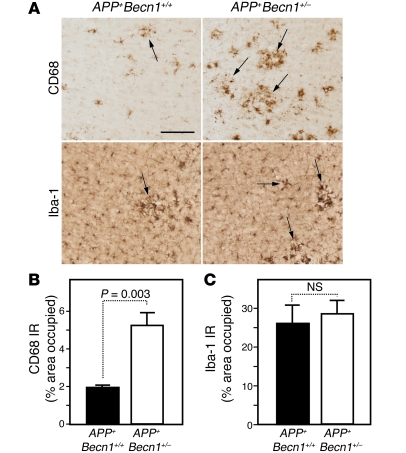
Figure 4. Microglial changes in APP+Becn1+/– mice.
(A–C) Microglial changes in the frontal cortex of 9-month-old female APP+Becn1+/– and APP+Becn1+/+ mice assessed by immunostaining with antibodies against CD68 and Iba-1. Shown are representative images (A) and quantification (B and C). Arrows denote microglial clusters around amyloid deposits. Values are mean ± SEM; mean differences were compared by unpaired Student’s t test. n = 7–8 per genotype. Scale bar: 50 μm.

