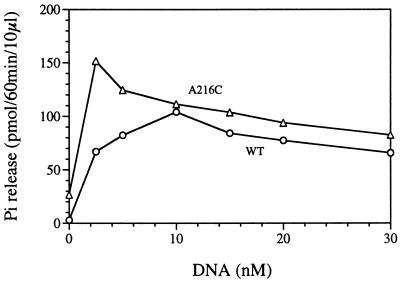
Figure 2.
Stimulation of the ATPase activity of NtrCA216C by an enhancer. ATPase activity of phosphorylated NtrCA216C (20 nM) was measured in the absence or presence of a synthetic DNA oligonucleotide that carries a strong enhancer (16, 24). It was compared with the ATPase activity of phosphorylated NtrCWT (20 nM). Pi release was measured at 60 min. Relevant NtrC proteins are indicated next to the curves: WT, MBP-NtrCWT; A216C, MBP-NtrCA216C.

