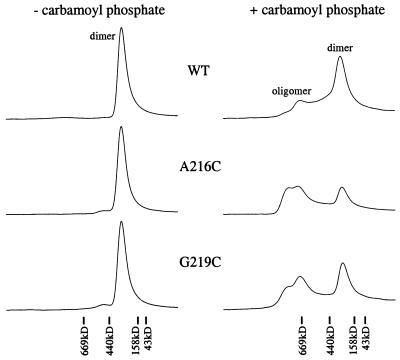
Figure 3.
Gel-filtration chromatography of unphosphorylated (− carbamoyl phosphate, Left) or phosphorylated (+ carbamoyl phosphate, Right) MBP-NtrCWT (WT), MBP-NtrCA216C (A216C), and MBP-NtrCG219C (G219C). The column was calibrated with a set of molecular mass standards: thyroglobulin, 669 kDa; ferritin, 440 kDa; aldolase, 158 kDa; ovalbumin, 43 kDa; whose positions of elution are shown as vertical bars. Proteins (100 μl at a concentration of 1 μM) were injected into the sieving column, and eluted proteins were detected by relative absorbance at 214 nm. Traces show elution profiles from 6 to 16 min after injection. Peak positions of dimer (≈200 kDa) and oligomer (≈600–800 kDa) of MBP-NtrC are marked.

