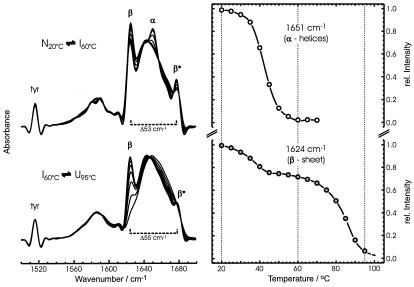
Figure 2.
(Left) IR spectra of Cro-V55C as a function of temperature, from the native structure (at 20°C), through the intermediate state (at 60°C), to the heat-denatured state (at 95°C). Spectra are shown after band narrowing by Fourier self-deconvolution (band-narrowing factor k = 2 and a half bandwidth of 16 cm−1). (Right) Intensity vs. temperature plot of the 1,651-cm−1 band, reflecting the unfolding of the α-helices (Upper), and of the band at 1,624 cm−1, reflecting the two-step unfolding of the β-sheets (Lower).

