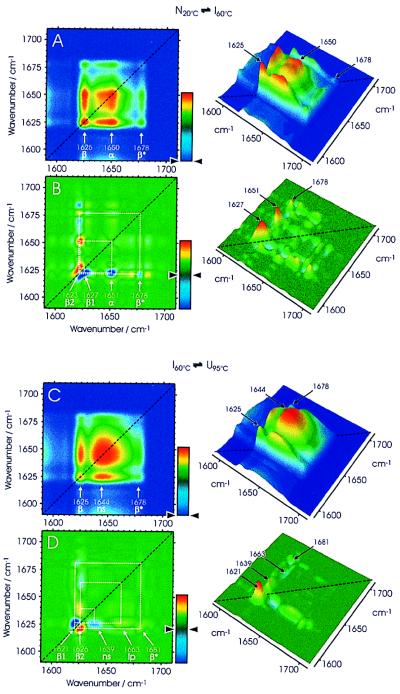
Figure 4.
The 2D correlation analysis of the IR spectra of Cro-V55C between 20°C and 60°C (A, synchronous; B, asynchronous plots) and of spectra between 60°C and 95°C (C, synchronous; D, asynchronous plots). The correlation plots are represented as 2D color intensity maps (Left) and also as pseudo-3D maps (Right) with the following color coding: blue, set to zero in the synchronous plots; green, set to zero in the asynchronous plots (see color bars). β and β*, the low and high frequency components, respectively, of the antiparallel β-sheet band; α, α-helices; ns, non-β-sheet structures; lp, loop structures.

