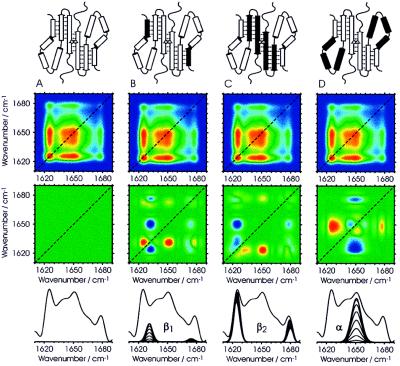
Figure 5.
Computed synchronous plots (panels with blue background) and asynchronous plots (panels with green background) obtained by simulating the spectral changes that occur during the formation of the stable intermediate assuming that there is a fully cooperative change of all band components (A), that the minor β-strand unfolds before the major part of the structure unfolds (B), that structural changes in the major β-sheet precede the overall unfolding (C), and that the disruption of the secondary structure starts with unfolding of the α-helical domain (D). Individual band components were obtained by curve fitting the experimental spectra. Segments marked in black in the pictorial description (Top) and in the stacked plots (Bottom) identify those secondary structure elements that were assumed to respond out-of-phase (i.e., earlier) during the simulated unfolding process.

