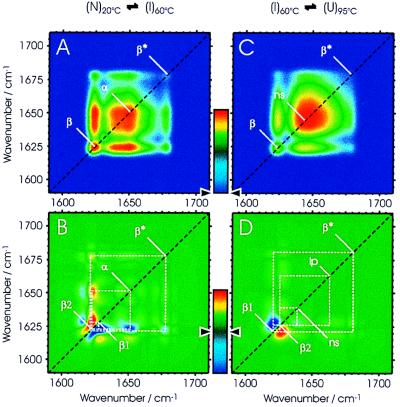
Figure 6.
Synchronous (A) and asynchronous (B) 2D IR correlation plots simulating the transition from the native to the stable intermediate state of the protein and synchronous (C) and asynchronous (D) 2D IR correlation plots simulating the unfolding of the intermediate state. For the simulation of the final 2D IR correlation plots, five bands were shifted relative to the first transition [1,632 and 1,674 cm−1 (−0.6°C); 1,650 cm−1 (−0.3°C); 1,624 and 1,678 cm−1 (+0.3°C)], and three bands were shifted relative to the second transition [1,623 cm−1 (−0.6°C); 1,639 cm−1 (−0.3°C); 1,625 cm−1 (+0.3°C)].

