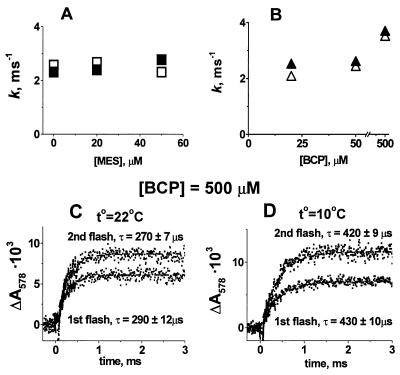
Figure 2.
Dependence of the rate of pH transients on the concentration of pH buffer, pH indicator, and temperature. (A) Dependence of the rate constants of pH transients on the concentration of pH buffer: □, B1; ■, B2. (B) Dependence of the rate constants of pH transients on the concentration of the pH indicator: ▵, B1; ▴, B2. In A and B and in Fig. 3, the fitting error was less than the symbol size. (C and D) pH transients of BCP after the first and second flashes at +22°C (C) and +10°C (D), respectively, in the presence of 500 μM of pH indicator. Conditions were the same as those described for Fig. 1.

