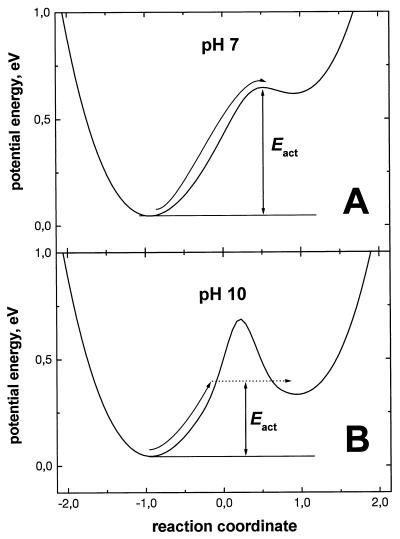
Figure 4.
Hypothetical energy profiles along the reaction coordinate of proton transfer from neutral water (left) to a terminal base (right) at different pH values. The difference between energy levels at two pH values is roughly determined by Eq. 3. (A) At neutral pH, the surface terminal groups (supposedly histidines) are in a direct contact with the surface water; thus, a low isotope effect is expected for the proton transfer from water. (B) At alkaline pH values, the buried amino acid residues overtake the function of terminal groups. The dashed arrow shows a proton tunneling through a potential barrier.

