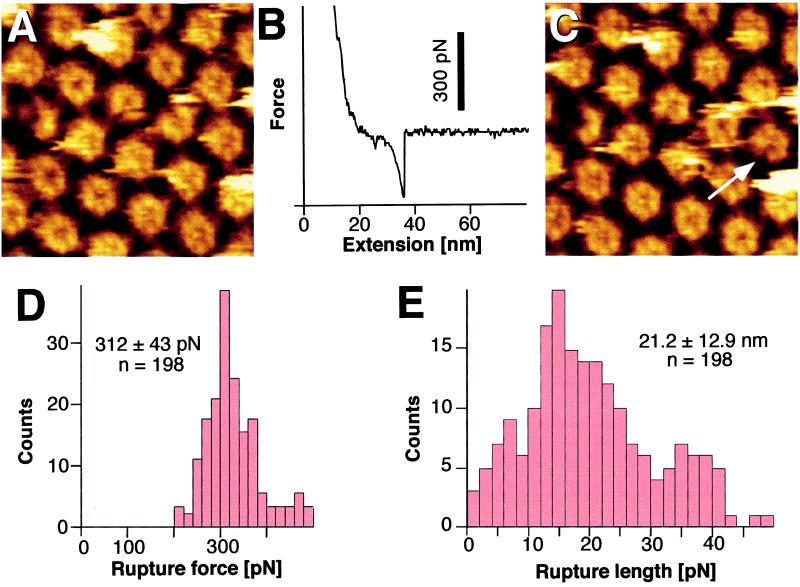
Figure 3.
Individual protomers can be pulled out of the HPI layer. (A) Control AFM topograph of the inner surface of the HPI layer. (B) Force-extension curve (type II) recorded on the inner surface with an adhesion force of about 300 pN at a separation of several nanometers from the protein surface. (C) The same inner surface area imaged after recording the force curves; a molecular defect corresponding to the size of an individual protomer is clearly discernible. The defective core on the left was used to correlate topographs C and A. (D) Histogram of the adhesion forces measured from 198 single-event extension curves. The peak is at 312 ± 43 pN. (E) The corresponding distances between the stylus and the protein surface at the rupture point. A peak is at 21.2 ± 12.9 nm. The bending of the cantilever was taken into account for evaluating the stretching lengths. Full gray-level range of the topographs corresponds to 3 nm.

