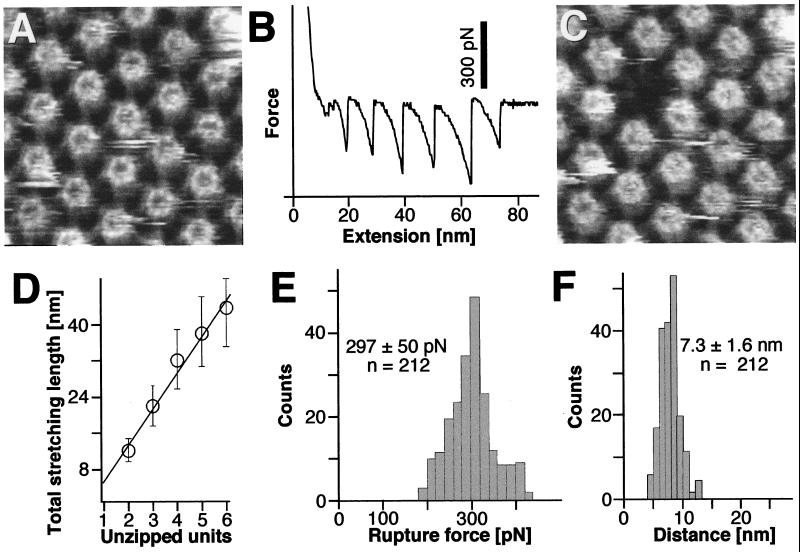
Figure 4.
Multiple protomers can be sequentially pulled out of the HPI layer. (A) Control AFM topograph of the inner surface of the HPI layer. (B) The force-extension curve recorded from this inner surface region shows a saw-tooth pattern with six force peaks of about 300 pN. (C) The same inner surface area imaged after recording the force curve; a molecular defect the size of a hexameric HPI protein complex has clearly been created. (D) Histogram of the distances corresponding to the separation of the force curve peaks against the number of missing protomers. The straight line obtained indicates a direct correlation between the force peaks and protomer extraction. (E) Histogram showing the adhesion forces measured from 212 force-extension curves. The peak is at 297 ± 50 pN. (F) Stretching distances between protomer disruption events have a sharp peak at 7.3 ± 1.6 nm. The defect core in the upper half of the frame was used to correlate topographs C and A. Full gray-level range of the topographs corresponds to 3 nm.

