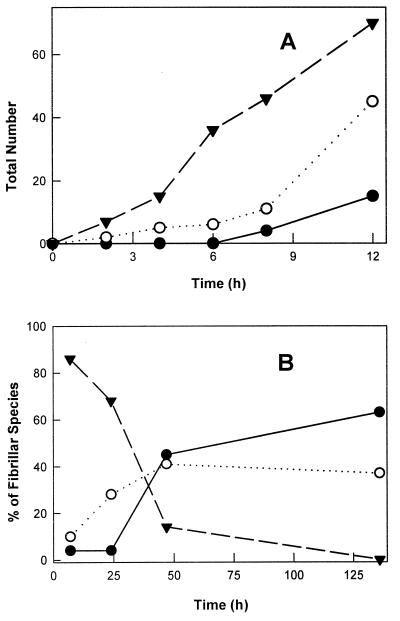
Figure 4.
(A) The number of filaments (triangles and dashed lines), protofibrils (open circles and dotted lines), and fibrils (filled circles and solid lines) observed in a 5- × 5-μm scan as a function of time, showing a more rapid increase in the number of filaments relative to protofibrils and fibrils at early time points. (B) The relative distribution of filaments, protofibrils, and fibrils (symbols as in A) for later time points, illustrating a decrease in the number of filaments with a simultaneous increase in protofibrils and fibrils.

