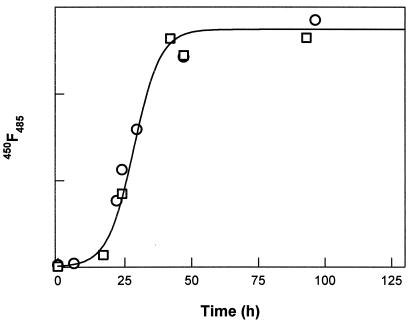
Figure 5.
The increase in the thioflavin T dye binding monitored by fluorescence emission during the fibril formation reaction for two different incubations is shown by open circles and squares; the line is a sigmoid fit to data. This increase in the thioflavin T dye binding correlates well with the increase in total length and number of fibrillar species (data not shown).

