
Figure 4.
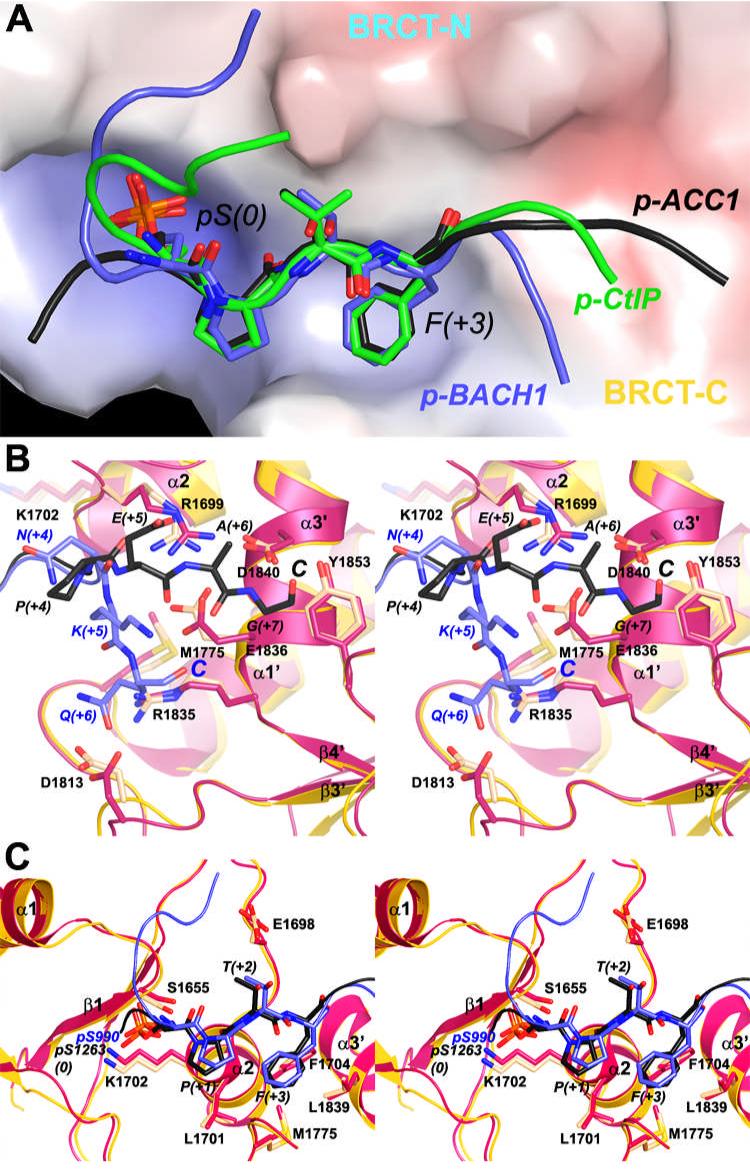
Conformational differences to other BRCT/phospho-peptide complexes. (A). The overall binding modes of the p-ACC1, p-BACH1 and p-CtIP peptides to the BRCA1 BRCT domains. The molecular surface of the BRCT domains is colored by the electrostatic potential. (B). Different binding modes of the C-terminal regions of the p-ACC1 and p-BACH1 peptides. The BRCT domains from the BRCT/p-ACC1 complex are colored in yellow (main-chain) and wheat (side-chain), and those from the BRCT/p-BACH1 complex are colored in red. The p-ACC1 (black) and p-BACH1 (light blue) peptides are drawn as stick and ribbon models. (C). Different binding modes in the central motif of the p-ACC1 and p-BACH1 peptides.