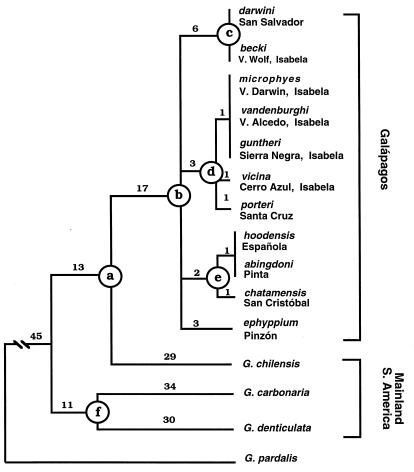
Figure 2.
Phylogenetic tree based on 962 bp of the 16S ribosomal and cytb mtDNA. The tree shown is the 50% majority rule consensus tree for MP with G. pardalis as the outgroup. Numbers above branches indicate branch lengths. All lettered nodes were obtained with all weightings for MP, NJ, and ML, and by using each gene separately. See Materials and Methods for details of the analyses; see Table 2 for statistical analyses of topology robustness.

