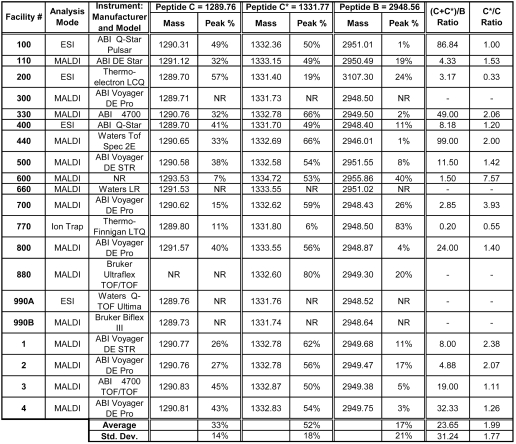
TABLE 6.
Mass Spectrometry Data for the Test Peptides
 |
Masses were obtained for the peptides by 21 facilities and 16 facilities also reported peak areas. Peak areas are given as a percent of the total peak area for all three peptides. Peptide ratios calculated from the relative peak areas for the different peak areas varied widely, and were not a reliable indicator of the relative amounts of the peptides. Std Dev: Standard deviation.
