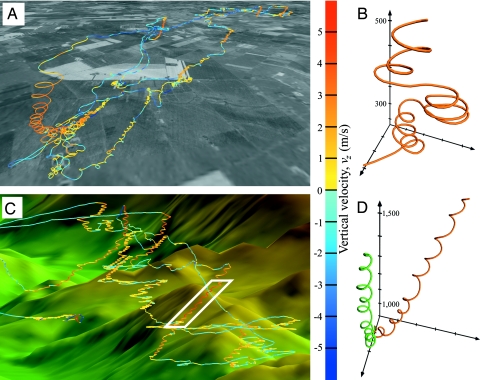
Fig. 2.
Visualizations of the track logs of a falcon and a paraglider. (A) Trajectory (track log) of a single flight of the falcon with the background being a black and white satellite map of the region. Coloring indicates the values of the vertical velocity component; red corresponds to climbing (mostly within thermals), blue to sinking (gliding parts). (B) An interesting feature of the falcon's thermalling flight is that from time to time it changes the direction of circling. Marks on the axes indicate 50-m distances. (C) Trajectory of a paraglider pilot with the local relief. (D) Compensating for the wind: the red trajectory corresponds to the original data (in the white box in C), whereas the same trajectory is shown in green after the effect of the wind has been eliminated. Marks on the axes indicate 100-m distances.

