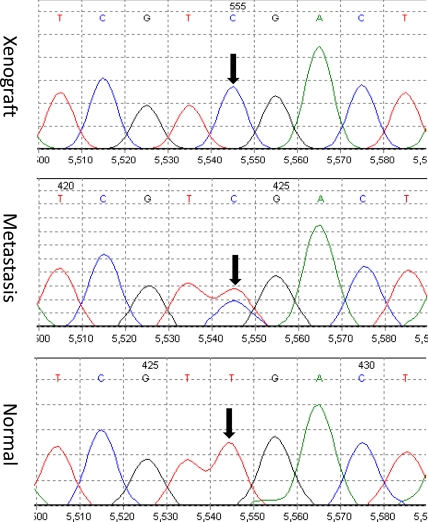
Fig. 2.
Representative examples of sequencing chromatograms of DNA from a xenograft, from the metastatic lesion from which the xenograft was derived, and from the patient's normal cells. Note that the ratio of the mutant to wild-type allele in the xenograft is higher than that in the metastatic lesion because the latter represented a mixture of neoplastic and nonneoplastic cells (stroma, white blood cells, etc.). The arrow points to the mutated base.

