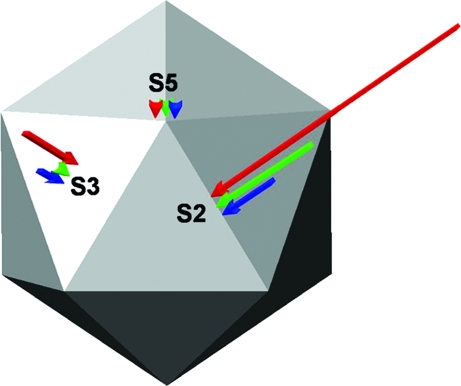
Fig. 5.
Schematic representation of the increase in stiffness of the DNA-filled virion, relative to the empty capsid, along the 5-fold (S5), 3-fold (S3), or 2-fold (S2) symmetry axes. Arrows refer to unmodified MVM (red), Asn183Ala mutant (blue), or Asp58Ala mutant (green). Arrow length is proportional to Δk, the difference in k value between the virion and the empty capsid. If Δk is not significantly different from zero according to a Student t test, an arrowhead is used.

