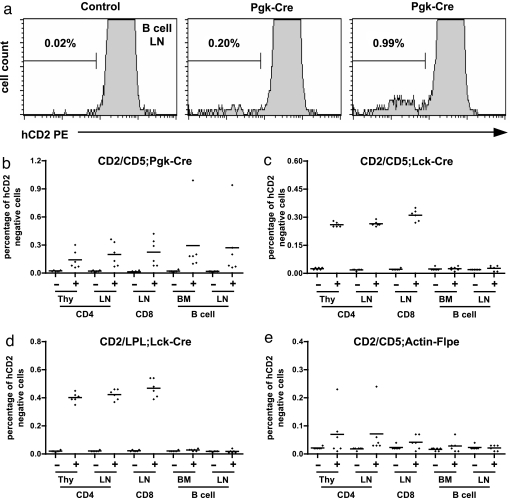
Fig. 3.
Detection of mitotic recombination in lymphocytes. (a) Representative FACS plots show the background signals in lymph node B cells of a control CD2/CD5 mouse and the appearance of hCD2 negative cells after mitotic recombination in two individual CD2/CD5;Pgk-Cre mice. (b) Summary of mitotic recombination result in CD4 T cells, CD8 T cells, and B cells from various lymphoid organs of CD2/CD5;Pgk-Cre mice and littermate controls. Thy, thymus; LN, lymph nodes; BM, bone marrow. +, Cre positive; −, Cre negative. Each dot represents data from one mouse. n = 6 for each genotype. (c) Summary of mitotic recombination in CD2/CD5;Lck-Cre and CD2/CD5 control mice. Labels, nomenclatures, and sample size are as in b. (d) Summary of mitotic recombination in CD2/LPL;Lck-Cre and CD2/LPL control mice. Labels, nomenclatures and sample size are as in b. (e) Summary of mitotic recombination test involving the Flp/FRT system. +, Flpe positive; −, Flpe negative. Other labels and sample size are as in b.

