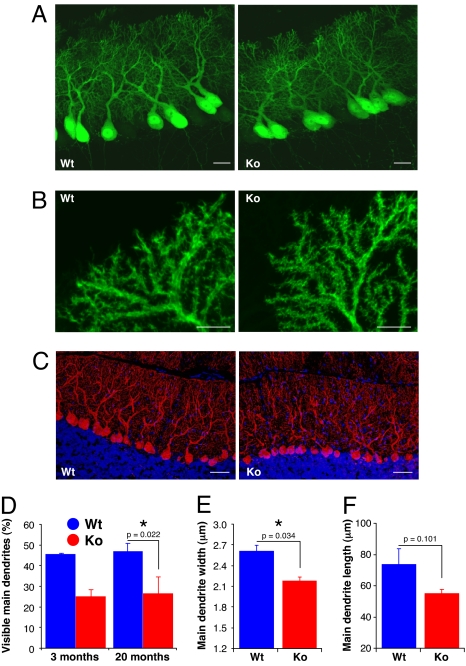
Fig. 2.
P-Rex2−/− mice have a defect in Purkinje cell dendrite morphology. (A and B) Cerebellar slices from 10-day-old EGFP-P-Rex2−/− (Ko) and littermate control EGFP-P-Rex2+/+ (Wt) mice were fixed and analyzed by confocal microscopy. (A) Purkinje cell alignment and axon and dendrite outgrowth in EGFP-P-Rex2−/− mice. (Scale bars, 20 μm.) (B) Purkinje cell dendritic branches in EGFP-P-Rex2−/− mice. Photos are representative of three sections from at least three mice per genotype. (Scale bars, 10 μm.) (C) Cerebellar slices from 3-month-old P-Rex2−/− (Ko) and P-Rex2+/+ (Wt) mice were fixed, permeabilized, and stained for Calbindin (red) and with Hoechst (blue). Photos are representative of three slices (≈500 Purkinje cells each) per genotype. (Scale bars, 50 μm.) (D) Quantification of P-Rex2−/− (Ko, red) and P-Rex2+/+ (Wt, blue) Purkinje cell dendrite structure. Cerebellar slices as in C from 3- and 20-month-old mice were scored by microscopy for the percentage of Purkinje cells with a clearly visible main dendritic trunk when focused on the cell body. Data are from at least two slices per animal, one animal per genotype for 3-month-old and three animals per genotype for 20-month-old mice. Values are mean ± range blind scores of two people. (E and F) Volocity analysis of high-resolution confocal image stacks of cerebellar slices from18-day-old EGFP-P-Rex2−/− (Ko) and littermate EGFP-P-Rex2+/+ (Wt) mice, three animals per genotype from two litters of different origins. Data are mean ± SE of 40–150 cells measured per mouse from several cerebellar slices per mouse. (E) Main dendrite width at a distance of one cell-body diameter from the cell body. Statistics are two-way ANOVA. (F) Main dendrite length, measured from the middle of the cell body to the first major branch point or, in the absence of that, as far as traceable (see also SI Fig. 10B).

