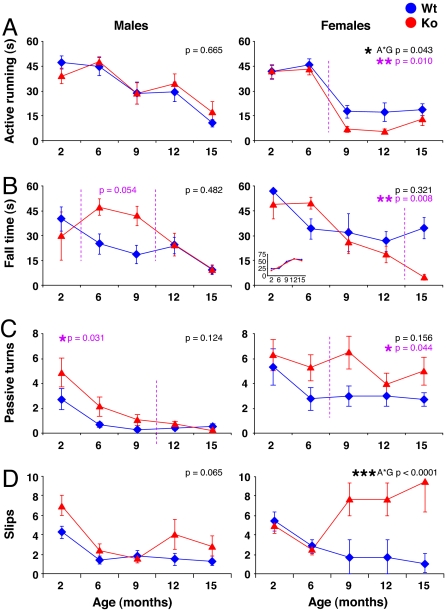
Fig. 3.
Rotarod performance is decreased in P-Rex2−/− mice. A cohort of 53 P-Rex2+/+ (Wt; blue) and P-Rex2−/− (Ko; red) mice, at least 12 females and 12 males per group, were trained and tested for their performance on the rotarod at different ages as detailed in Materials and Methods. Values are from the second run of the performance test. (A) Active running: time successfully run on the rod before either turning passively with it or falling off at 42 rpm. (B) Fall time: latency to fall at 42 rpm, plotted for animals that fell. Percentage of animals falling is shown in Inset. (C) Passive turns: number of passive turns clinging to the rod (mean at three top speeds). (D) Slips: number of foot slips per animal. All data are mean ± SE; statistics are ANOVA, as detailed in Materials and Methods. P values in black denote differences between Wt and Ko animals; in purple, those before or after a certain age as indicated by stippled purple lines; and A*G values are those that are significant between genotypes as a function of age.

