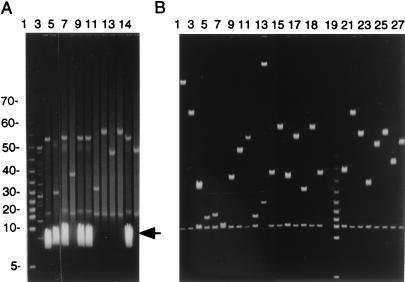
Figure 3.
(A) FIGE analysis of NotI-digested DNAs from two independent nested-deletion libraries from PACs are shown in lanes 2–6 and 7–14. The heavy band marked with the arrowhead represents transposon plasmid DNA. (B) An identical analysis of clones isolated from the same two deletion libraries (lanes 1–18 and 20–27, respectively) after the clones passed through the ampicillin sensitivity screen. Lane 19 displays a 5-kb ladder. Lane 11 shows an example of a PAC deletion without the 15.5-kb vector band; therefore, it does not arise through authentic loxP recombination.

