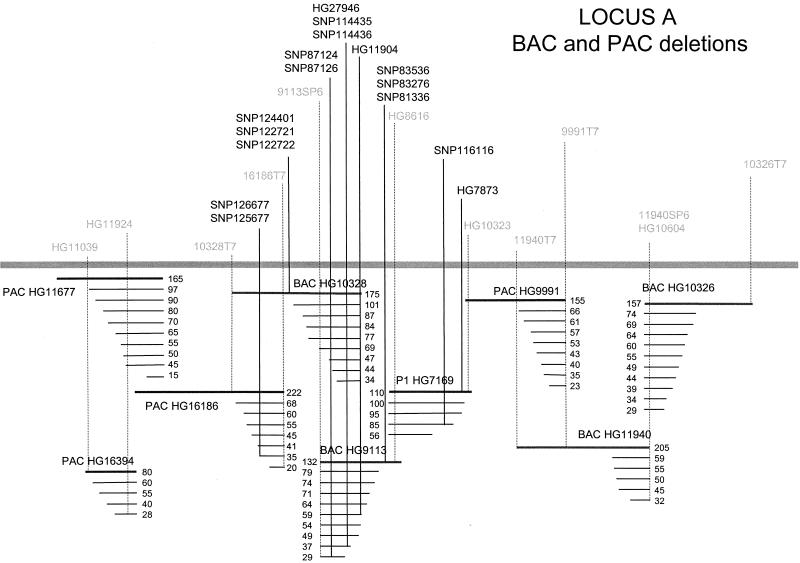
Figure 4.
Schematic representation of SNPs (bold) and markers (gray) positioned on a region of cloned human genomic DNA as determined by nested deletion analysis of the corresponding PAC, BAC, and P1 clones. SNPs were generated from either the deletion-end sequencing approach described in this manuscript, the random-subclone library approach (4), or from inter-Alu libraries. The positions and relative orientation of the large insert clones were obtained by localizing the SNPs and other markers on the nested deletion series of the originating clone, together with a positive PCR amplification from clones other than the source clone. The overlap between PAC HG16394 and PAC HG16186 was determined by dual-color FISH. The solid bar represents a genomic insert, and the series of thinner lines immediately below it represent the deletions generated from that particular clone, with the sizes of the inserts as determined by FIGE analysis given to the right of each clone. This is not a comprehensive SNP map, for only regions resulting in the identification of a SNP are indicated by a vertical line, and the entire region covered by these clones was not tested for the presence of SNPs.

