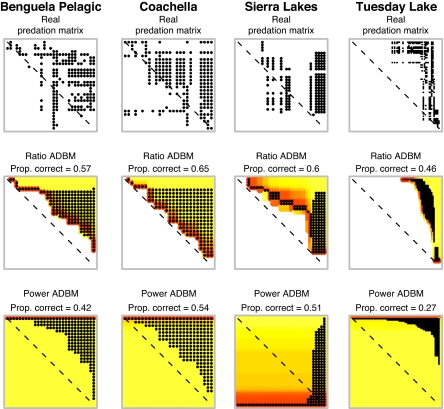
Fig. 3.
Four real food webs and various models of them. Each predation matrix describes a food web, with resources in rows and consumers in columns. Body size increases from left to right and top to bottom. A black dot indicates the consumer in that column feeds upon the resource in that row. Hence, dots in the upper right triangle indicate feeding links where consumers are larger than their resources. The dashed diagonal line represents the position that cannibalistic links would occupy. Yellow to red indicate low to high resource profitability in the ADBM models. Here, consumer diets (columns of black dots) always include the darker red (most profitable) resources and extend by different amounts into yellows (less profitable resources). Ratio and power refer to the handling time allometries (see Materials and Methods). The predation matrices of all 15 real webs and their models are in SI Appendix.

