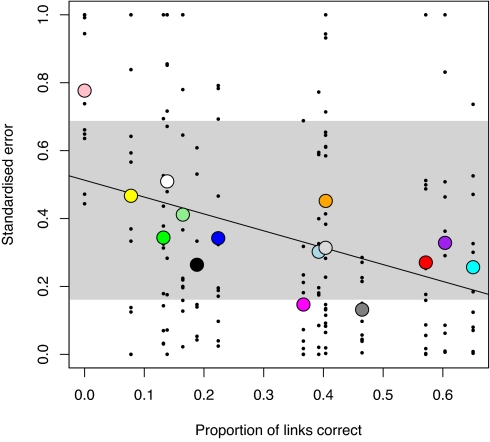
Fig. 4.
Ability of the ADBM to predict food web structure. The standardized error in predicting 12 food web structural properties (listed in the SI Appendix) decreases with increases in the proportion of links correctly predicted. Large colored points are the mean standardized error of the ADBM for each web. Small black dots indicate the standardized error of each of the 12 properties for each web. Solid line is linear regression through the means (t = 3.0, df = 13, P = 0.01). The range of mean standardized error of the niche model (11) is shown by the vertical extent of the gray rectangle. The key in Fig. 2 applies.

