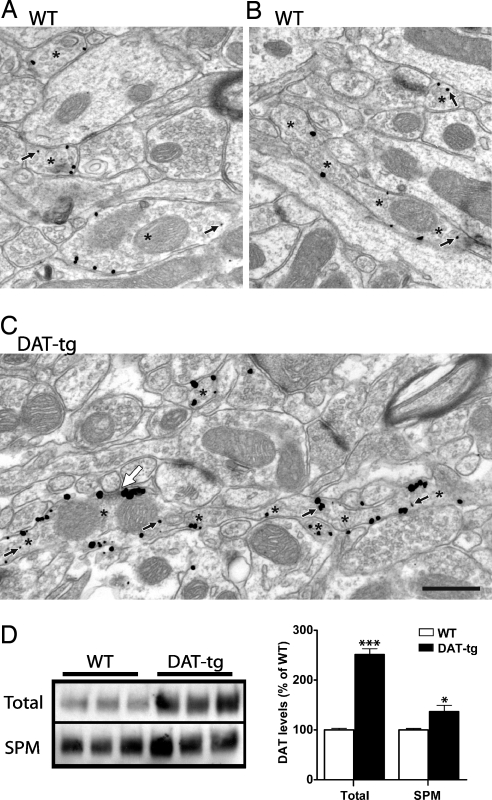
Fig. 3.
Subcellular localization of DAT by electron microscopy and membrane fractionation. Dorsal striatum of WT (A and B) and DAT-tg (C) mice show the density of Immunogold–silver labeling for DAT. Immunoreactive axons are identified by asterisks, with two profiles cut longitudinally indicated by multiple asterisks (B and C). Small black arrows indicate cytoplasmic gold particles; all other gold particles are associated with the plasma membrane. The large white arrow shows a synapse formed by the longitudinally sectioned axon most likely onto the neck of a spine. Immunoreactivity for DAT occurs in a perisynaptic location. (Scale bar: 500 nm.) (D) Representative DAT Western blot analysis of total or synaptic plasma membrane fractions from WT and DAT-tg animals. Data are means ± SEM (six per group in duplicates). *, P < 0.05; ***, P < 0.001.

