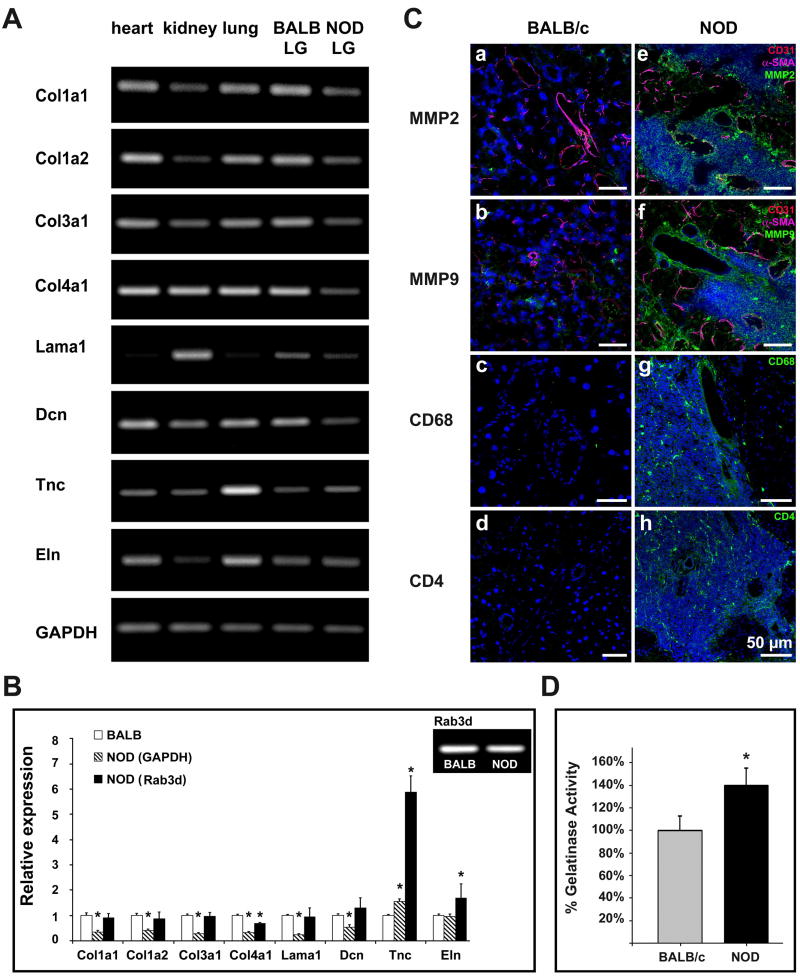
Fig. 5.
(A) Gene expression analysis of age-matched (18 weeks) NOD LGs compared to LG tissues of BALB/c mice showing a down-regulated expression of collagens I, III and IV, laminin 1, and decorin, as well as an increased expression of tenascin C in NOD LGs. No significant changes in elastin expression were noticed. (B) Real-time RT-PCR analysis (*-P<0.05 versus BALB/c), and Rab3d-expression pattern in BALB/c and NOD LGs. (C) Immunohistochemical staining reveals a dramatic up-regulation of MMP2 and MMP9 in areas of inflammation in NOD LG tissues (a-d versus e-h). Images show positive staining for MMP2 (a, e), MMP9 (b, f), CD68 (c, g) and CD4 (d, h) in green; endothelial cells (CD31) in red, and smooth muscle (SMA) in magenta (a, b, e, f); as well as cell nuclei (DAPI) in blue. (D) The gelatinase activity assay reveals a statistically significant increase of MMP2/9 activity in NOD LGs when compared to BALB LGs (*-P<0.05 versus BALB/c).

