Fig. 8.
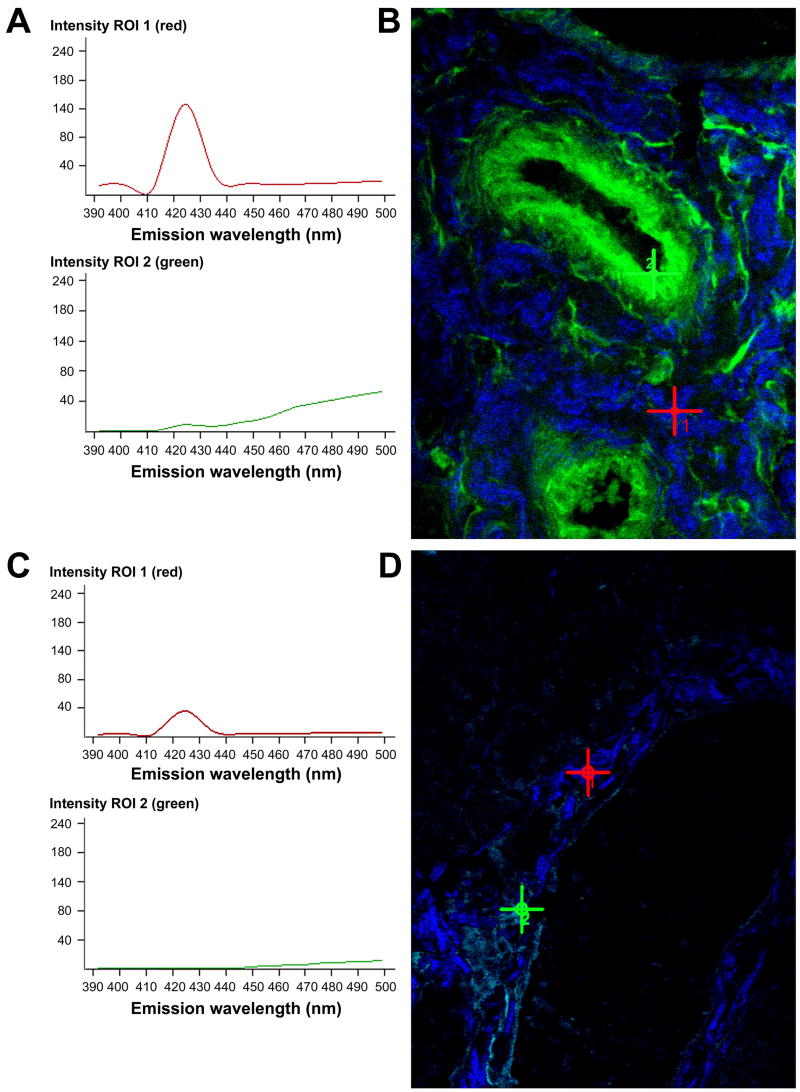
Spectral fingerprinting of BALB/c (A, B) and NOD (C, D) LG tissues using comparable laser powers and excitation wavelengths of 860 nm (ROI 1, red) and 740 nm (ROI 2, green). (A, C) The graphs represent peak SHG intensities of collagenous structures (ROI 1, red), as well as peak autofluorescence intensities of elastin-containing fibers and cells (ROI 2, green) in the corresponding lambda stack overlay image (B and D), denoted by the red (ROI 1) or the green (ROI 2) cross. (B, D) The red cross depicts the blue SHG signal of collagen emitting at about 425 nm. The green signal (green cross) at a peak emission wavelength of approximately 510 nm corresponds predominantly to elastic components. Note the aberrant, very faint NOD LG SHG signal (C and D), indicating a substantial ultrastructural deterioration and disintegration of most collagen fibers. Almost no signal for elastin-containing structures is detectable in NOD tissues.

