
Figure 1.
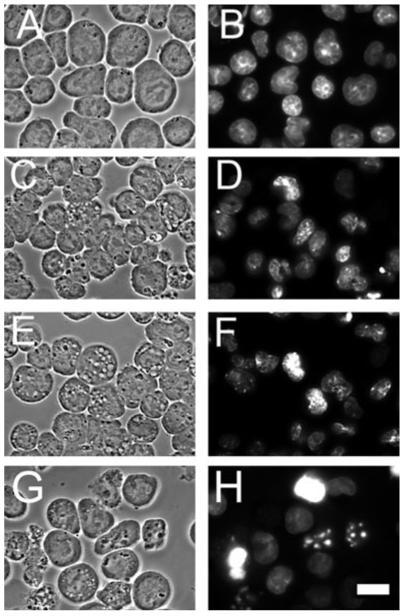
Effects of a 60 min incubation with 0, 10 or 15 μm HA14-1 on L1210 cells. A, C, E, G = phase-contrast images; B, D, F, H = HO342 fluorescence. A, B = controls, C, D = 10 μm HA14-1; E, F = 15 μm HA14-1. For comparison (G, H), effects of a 25 μm HA14-1 concentration (LD50 conditions) are also shown. White bar in panel H = 10 μm. Autophagic vacuoles can be seen in panels C, E and G.