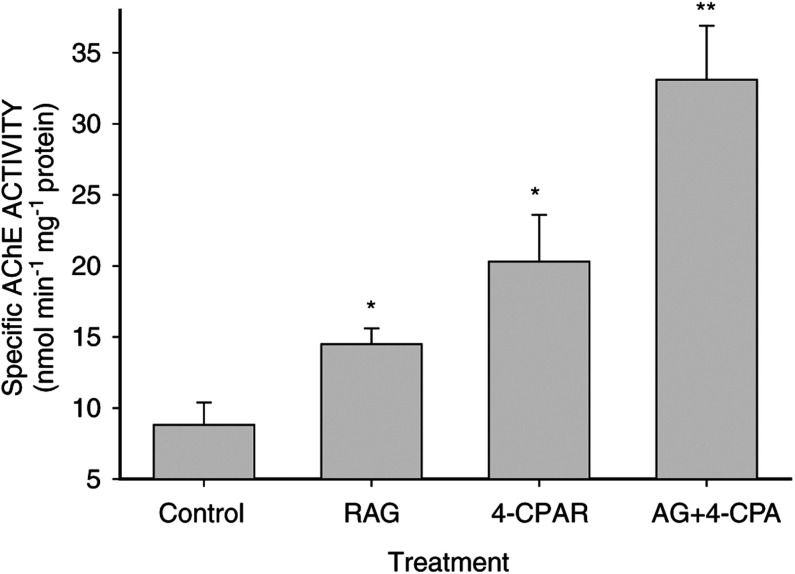
Figure 4.
Effects of RAG and 4-CPA on AChE activity in LA-N-5 cells. Cells were cultured for 5 days in the presence of 5 μM RAG, 3 mM 4-CPA, 5 μM RAG+3 mM 4-CPA, or solvent control as indicated. Bars represent the mean±s.e.m. of four independent experiments. * Indicates a significant difference between the single treatment as compared to the control. ** Indicates significance between combination treatment and treatments with either 4-CPA or RAG alone (P<0.05).

