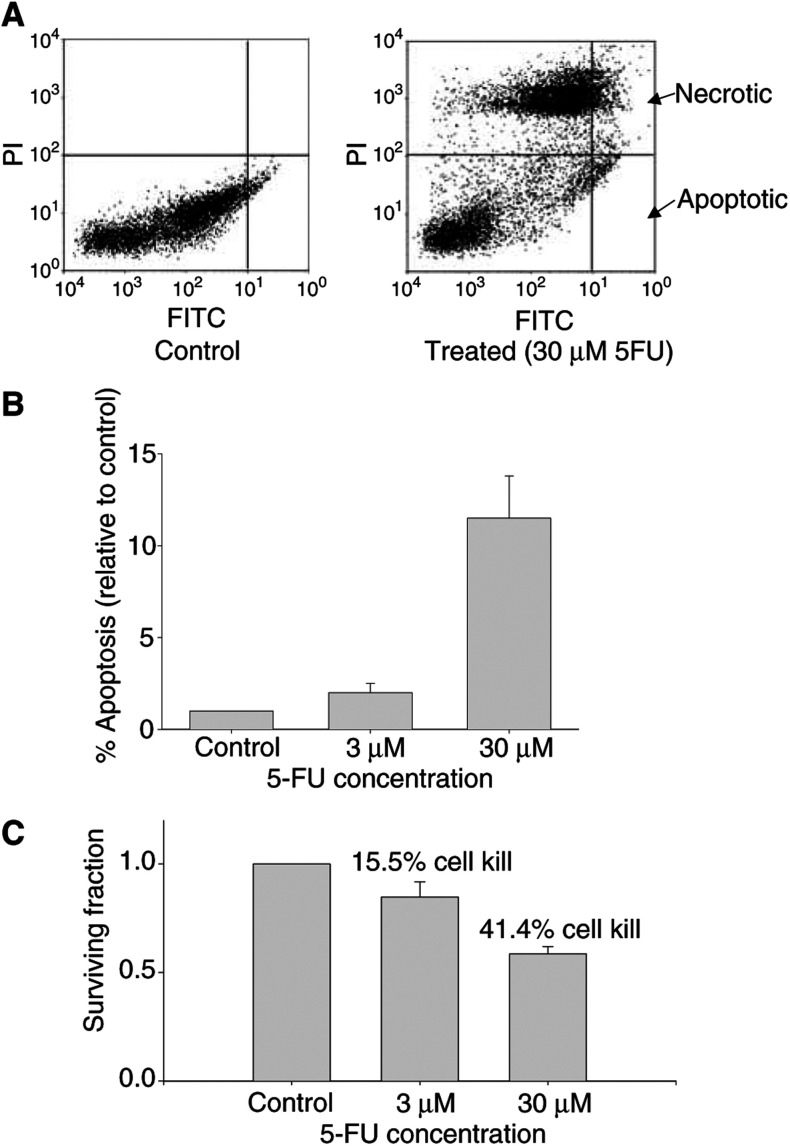
Figure 2.
5-Fluorouracil-induced cell death in RIF-1 cells in vitro. (A) Flow cytometry of TUNEL-stained control (PBS treated) and 5-FU treated (30 μM) cells. Data were analysed by setting quadrants on the FACS data such that 1% of control cells were in the lower right quadrant (FITC positive – PI negative; apoptotic cells); the same quadrant was then placed on the FACS data from corresponding treated cells. (B) Proportion of apoptotic cells relative to control cells. Data are mean±s.e.m. (n=4). (C) Clonogenic survival of control and 5-FU-treated cells expressed as a fraction of controls. Data are mean±s.e.m. (n=12).

