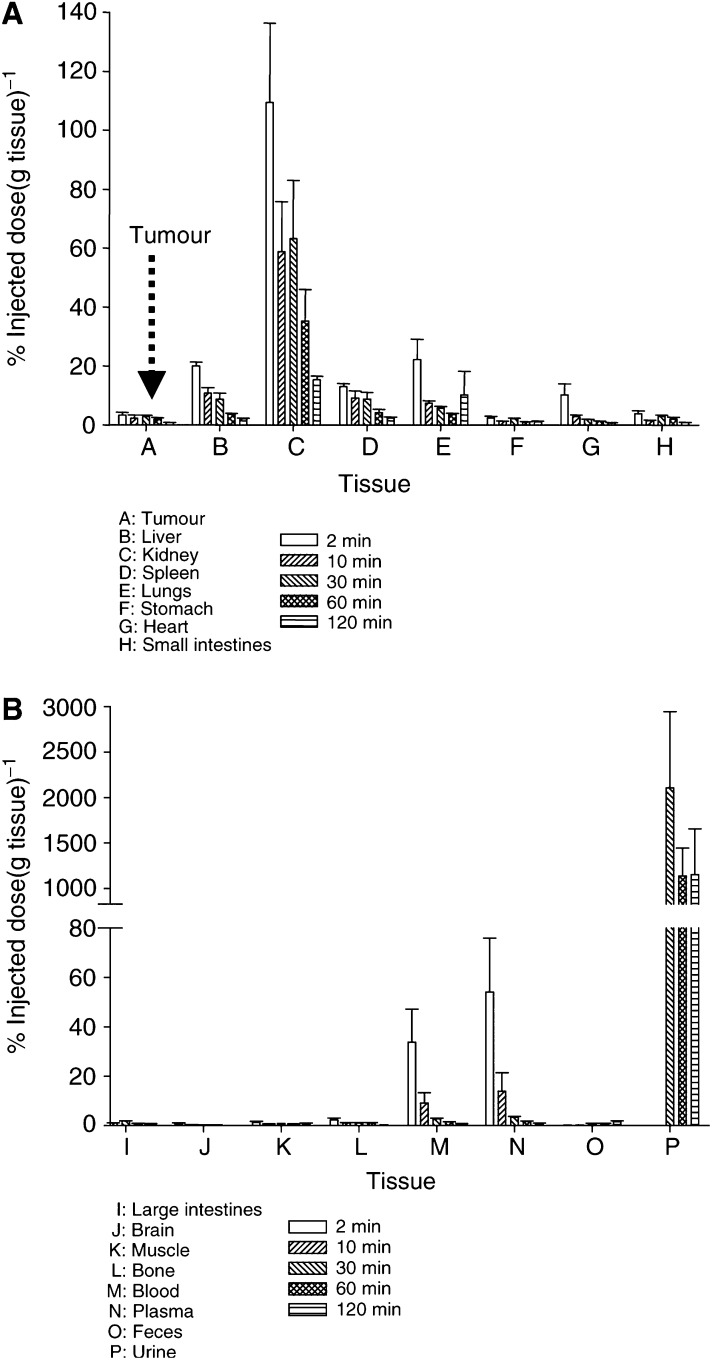
Figure 3.
Biodistribution of [125I]SIB–annexin V in untreated RIF-1 tumour bearing C3H/Hej mice at 2, 10, 30, 60 and 120 min. Data from (A) tumour, liver, kidney, spleen, lungs, stomach, heart and small intestines, and (B) large intestines, brain, muscle, bone, blood, plasma, faeces and urine. The two panels show data from the same group of mice; note that the Y-axis is different for the two panels. Data are mean±s.e.m. (n=3–5 per time point).

