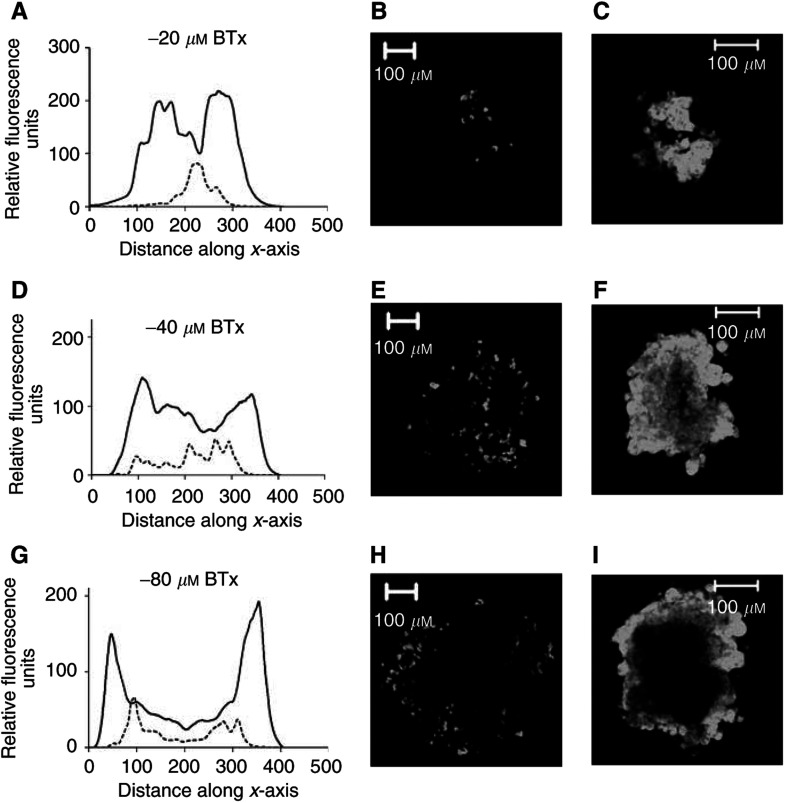
Figure 5.
Cellular distribution of BODIPY-taxol in TSAdr. TSAdr (d=300–400 μM) were incubated with 2.5 μM BODIPY-taxol for 60 min at 37°C in the presence or absence of 10 μM nicardipine. Images were produced by optical sectioning to a depth of 80 μM at 4 μM increments along the z-axis of the tissue. The fluorescence intensity was measured for each of the images along the xy-axis. (A, D and G) intensity measured at depths of 20, 40 or 80 μM from the periphery along the z-axis. (B, E and H) images taken in TSAdr at depths of 20, 40 or 80 μM along the z-axis (intensities are shown in the graphs as a dotted line). (C, F and I) images obtained from TSAdr that had been incubated with 10 μM nicardipine prior to addition of BODIPY-taxol (intensities shown in the graphs as solid lines).

