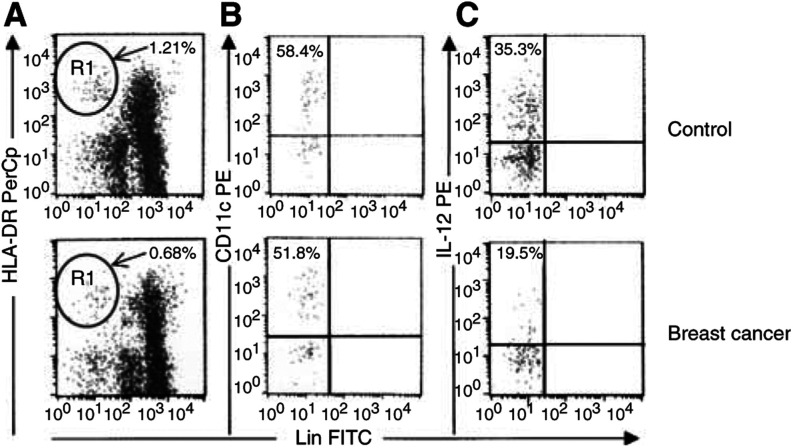
Figure 4.
Identification and characterisation of PB DCs in whole peripheral blood samples. Comparison between representative flow cytometric analyses from a control subject (upper line) and a breast cancer patient (lower line). (A) Gated on a mononuclear cell analysis region, DCs were identified on the basis of their lack of labelling for the lineage markers CD3, CD14, CD16, CD19 and CD20, but positive staining for HLA-DR (R1). (B) Gated on R1 events, myeloid DCs were identified for their surface expression of CD11c. (C) Gated on R1 events, PB DCs producing IL-12 upon LPS stimulation were identified for their intracellular accumulation of the cytokine.

