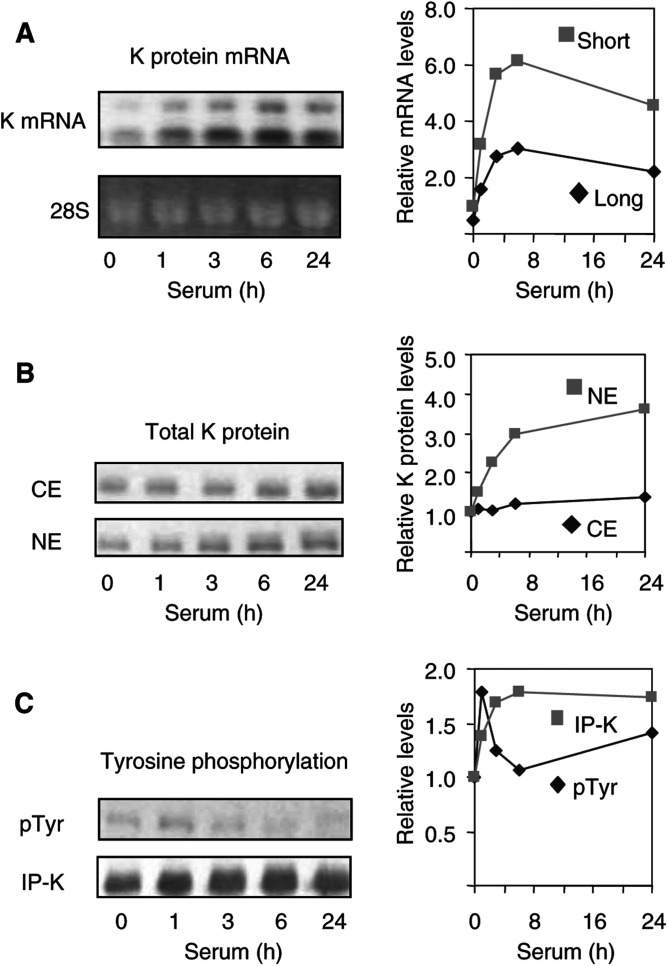
Figure 2.
K protein expression in serum-treated hepatocytes. After 48 h of serum deprivation, HTC-IR cells were treated with 15% FCS. At given time points, cells were harvested, and total RNA and proteins as well as nuclear and cytoplasmic proteins were extracted. (A) Total RNA was electrophoresed in a 1% agarose/formaldehyde gel and RNA was visualised with ethidium bromide and photographed with digital camera (DC40, Kodak). After RNA transfer, the nylon membranes were probed with 32P-labelled K protein cDNA. Autoradiographs were photographed with a digital camera (DC40, Kodak). Densitometric analysis was carried out using OptiQuant™ Image Analysis Software (Packard meriden, CT, USA). The mRNA levels shown in the graph were normalised to the levels of 28S. (B) Protein extracts were resolved by SDS–PAGE followed by Western blotting with anti-K protein antibody. Blots were scanned, and densitometric analysis of K protein bands was performed using OptiQuant™ Image Analysis Software. (C) Anti-K protein immunoprecipitates from total cell extracts (300 μg protein) were resolved by SDS–PAGE and immnunobloting was performed with either anti-phosphotyrosine (pTyr) or anti-K protein (K) antibodies. Densitometric analysis was done as in (B).

