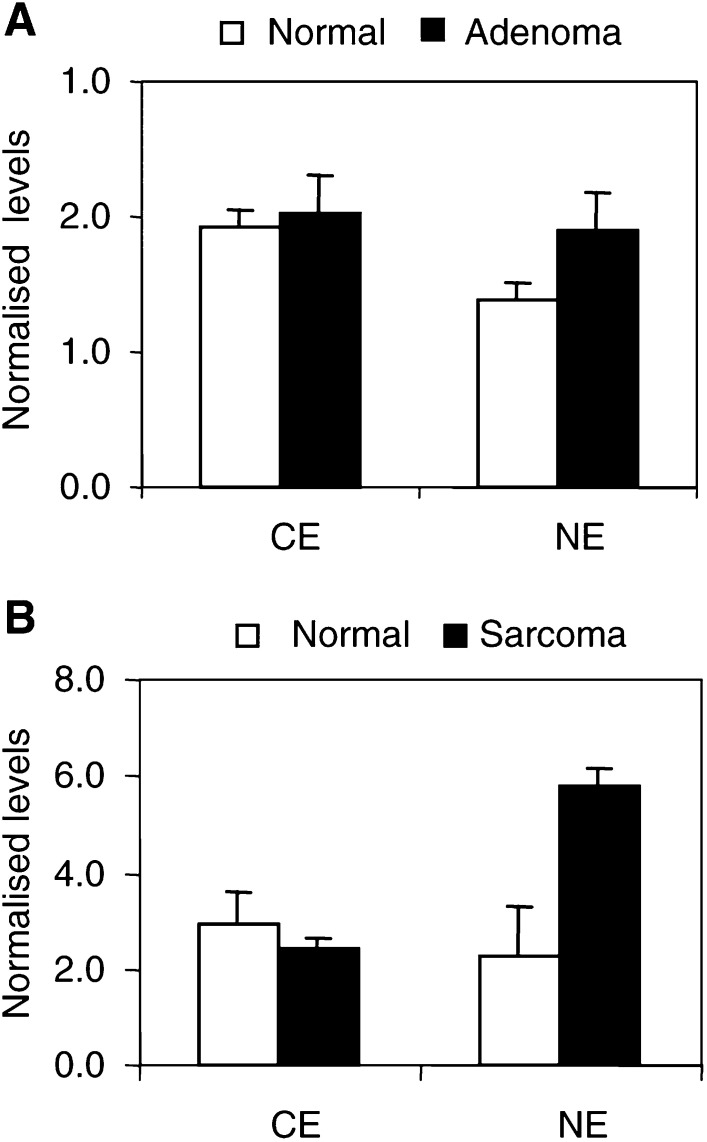
Figure 7.
Expression of K protein in spontaneous adenomas and implanted sarcomas in mouse livers. Cytoplasmic (CE) and nuclear (NE) extracts were prepared from spontaneous liver adenomas (adenoma), implanted sarcomas (sarcoma) and normal liver parenchyma (normal) surrounding these tumours. Levels of K protein were analysed in Western blots as in Figure 1. Results are expressed as the ratio of levels measured in the tumour (tumour) and those in the normal tissue (normal) of the same liver.

