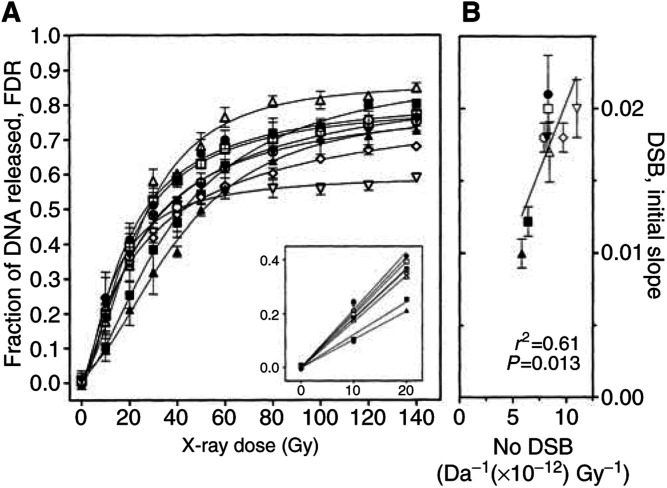
Figure 3.
(A) Induction of dsb measured by CFGE. Cells were irradiated on ice with doses up to 140 Gy immediately followed by the measurement of dsb by CFGE. The increase of FDR with dose was fitted by nonlinear regression. The initial slope of FDR was determined by linear regression of the data obtained for doses up to 20 Gy (insrt). (B) Correlation between the number of dsb induced, as calculated from Figure 4, and the initial slope, as taken from Figure 3A. The symbols correspond to those in Figure 1.

