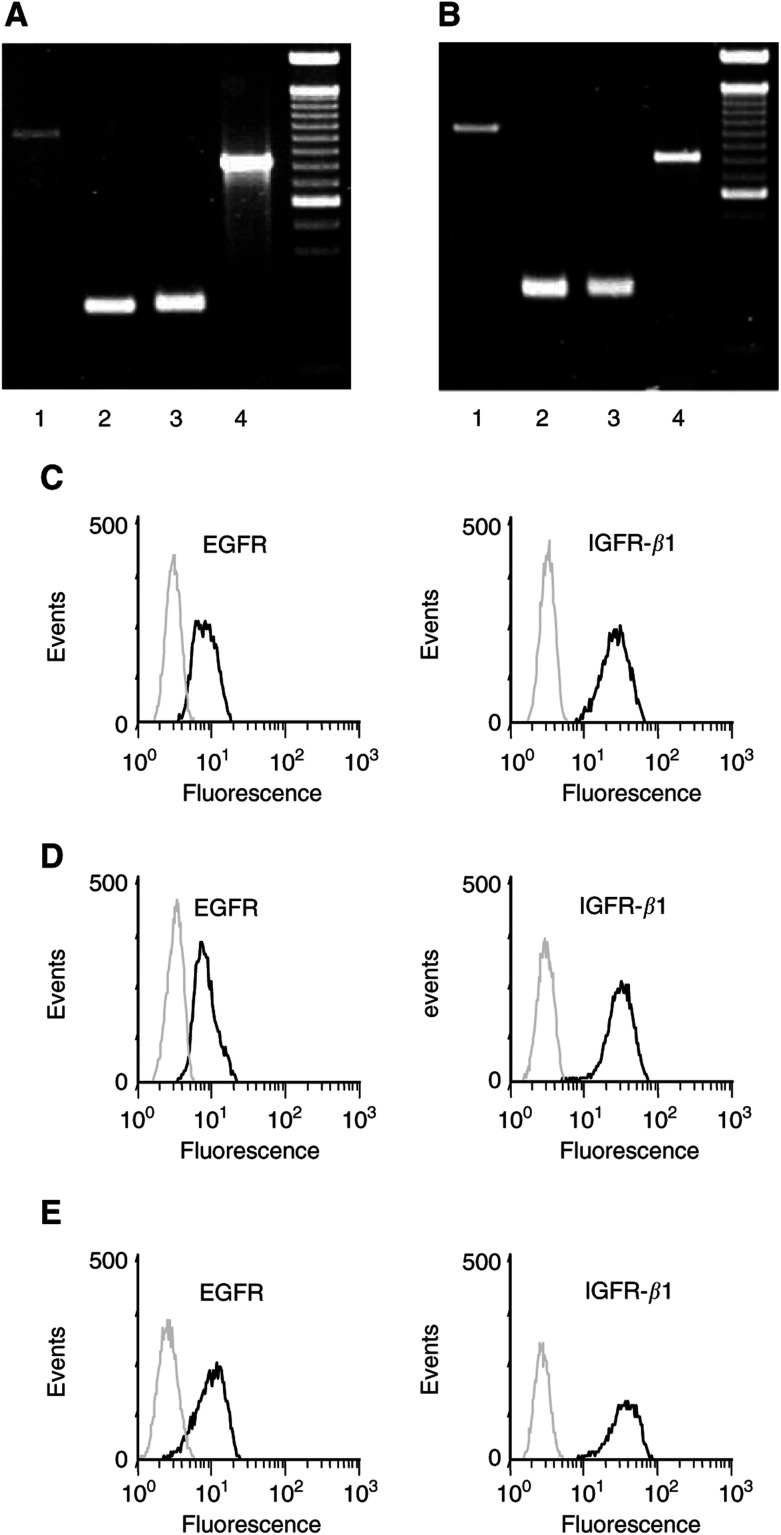
Figure 1.
mRNA and protein expression of EGFR and IGFR in neuroendocrine tumour cells. (A, B) mRNA expression of EGFRvIII (lane 1), EGFR-1 (lane 2) and IGFRβ-1 (lane 3) was evaluated in CM (A) and BON tumour cells (B). β-Actin was used as positive control (lane 4 in A and B), 100 bp DNA ladder. (C–E) Flow cytometric analysis of the expression of EGFR and IGFRβ-1 proteins in CM cells (C), BON cells (D) and STC-1 cells (E). Black lines: cells stained with specific polyclonal antibodies against either EGFR or IGFRβ-1; grey lines: negative controls.

