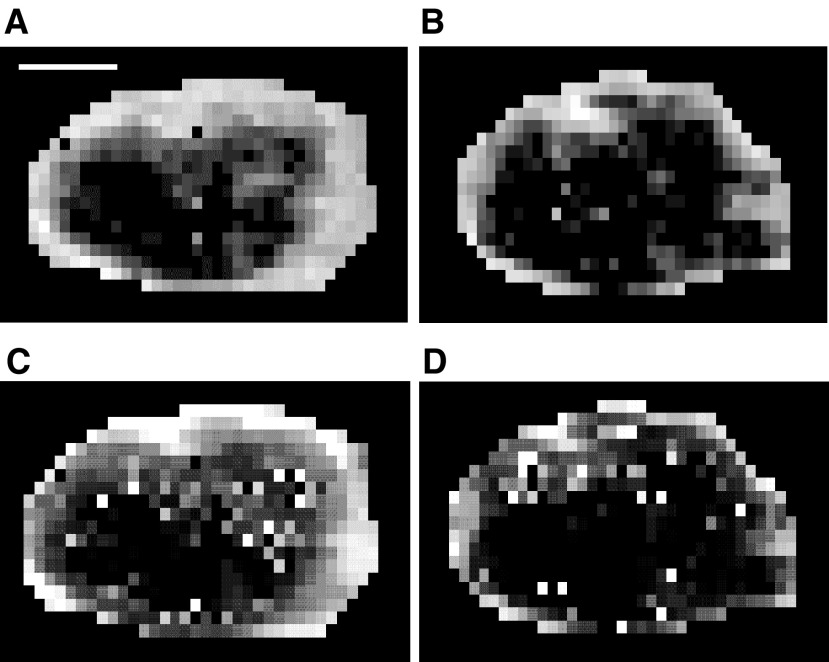
Figure 3.
Ktrans (A,B) and VE (C,D) maps for matched slices through the centre of one tumour obtained pre (A,C) and post (B,D) dosing with 50 mg kg−1 of ZD6474. White areas have high values for Ktrans or VE. Grey voxels have low values and black voxels are those that could not be fitted to the Tofts and Kermode model generally as a result of very slow washin and washout of contrast during the study period. The white bar in (A) is 3 mm long.

